Capacity Isn't Persistence: What a Trillion Dollars Can and Can't Do for the Yen
In the last week of July, Japan did something it had not done in 28 years: it bought yen together with the United States. Goldman Sachs now estimates Tokyo has roughly $1 trillion in reserves to keep doing it. That number is real. It is also the wrong number to watch.
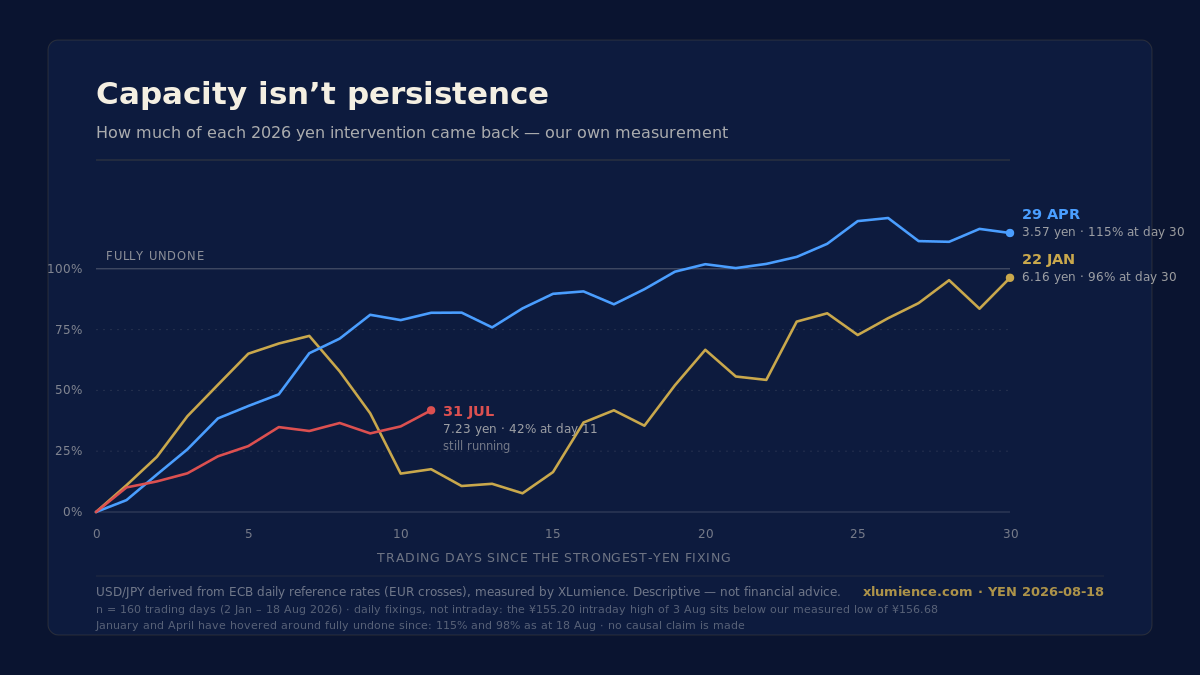
Capacity tells you how often Japan can intervene. It tells you nothing about whether an intervention holds. That second question is measurable, so we measured it — every intervention episode of 2026, from the pre-intervention high to the strongest-yen fixing that followed, and then how much of that move came back.
What the measurement shows
January: a 6.16-yen move, half of it returned within four trading days, and 115% by now — the yen is weaker today than before that intervention. April: a 3.57-yen move, half back within seven trading days, 98% by now. Both episodes have been all but fully undone.
July is the exception, and not in the direction a sceptic would want: a 7.23-yen move, of which 42% had returned after eleven trading days. This intervention has held better than either of its predecessors. What it has not done is hold completely.
What the full article covers
The plumbing change that created the trillion-dollar headline and what it actually protects. The positioning data that removes the obvious explanation. The strongest counterargument, given the floor. Japan's constrained rate lever, the September BoJ meeting, and the GDP revision that lands nine days before it. The Japanese research, read in the original, that explains why ¥160 may not be "too cheap" at all. And why a desk that covers XRP reads Mizuho at all.
Tell us — two doors
If you have a quick take, pushback or a one-line correction: reply under the article post on @XLumience. If you have something longer — a counter-reading, a data request, a correction with sources: come through our contact page. We read everything, and corrections get logged openly. Misses included; that's the house rule.
Sources: ECB daily reference rates (EUR/JPY, EUR/USD), 2 January – 18 August 2026, USD/JPY derived and persistence measured by XLumience; Cabinet Office of Japan, Quarterly Estimates of GDP for April–June 2026 (first preliminary estimates, 17 August), read in the original; Reuters (14 August) on the Bank of Japan; Bloomberg on CFTC positioning data (14 August); Mizuho research (29 July), read in Japanese; The Economist, "When Japan buys yen, it unwinds a dangerous trade", read through the Japanese summary by Masumi Sai (崔真淑, @masumasu033) rather than the original.
XLumience publishes daily XRP intelligence — on-chain, regulatory and market context, logged transparently, misses included. This is descriptive analysis, not investment advice.